Difference between revisions of "Flux balance analysis"
(→FBA via Analysis tab) |
|||
| (31 intermediate revisions by one user not shown) | |||
| Line 1: | Line 1: | ||
<font size="3"> | <font size="3"> | ||
| − | [https://www.ncbi.nlm.nih.gov/labs/pmc/articles/PMC3108565/ <b><i>Constraint-based flux balance analysis (FBA)</i></b>] is a mathematical approach that enables to provide a holistic view of the cellular metabolism in pro- and eukaryotes and predict flux distribution in a global (on a genome-scale level) metabolic network both under a range of environmental conditions and genetic perturbations. The maximization of the biomass equation is typically used as an objective function of the model for FBA. | + | [https://www.ncbi.nlm.nih.gov/labs/pmc/articles/PMC3108565/ <b><i>Constraint-based flux balance analysis (FBA)</i></b>] is a mathematical approach that enables to provide a holistic view of the cellular metabolism in pro- and eukaryotes and predict flux distribution in a global (on a genome-scale level) metabolic network both under a range of environmental conditions and genetic perturbations. The maximization of the biomass equation is typically used as an objective function of the model for FBA. There are two ways to run the analysis in the BioUML. Below is a step-by-step instruction for both ways. |
</font size="3"> | </font size="3"> | ||
| − | |||
| − | ==FBA via | + | ==FBA via Diagram== |
<font size="3"> | <font size="3"> | ||
| − | + | If the {{Type link|diagram}} contains fluxes properties written as fbc extension of the SBML "FBC table" tab can be used. Advantage of this tab usage is lack of necessity in creation table with data about fluxes: it will be created automatically using {{Type link|diagram}}. The step-by-step instruction of the analysis will be demonstrated on the <i>[https://ict.biouml.org/bioumlweb/#de=data/Collaboration/FBA%20models/Data/Geobacillus%20icigianus/iMK1321_Model iMK1321]</i> model for <i>Geobacillus icigianus</i> developed by our research group and [https://doi.org/10.3390/microorganisms8071002 recently published]. <b><i>Note:</i></b> opening of the large-size diagram may take a while due to the size and layouting of the diagram. | |
| − | + | ||
| − | |||
| − | |||
| − | |||
| − | |||
| − | |||
| − | |||
| − | [[File: | + | [[File:FBA_viaDiagram_Fig1_18_03.png|1000px]] |
| − | <span style="font-size: 90%"> '''Figure 1.''' | + | |
| + | <span style="font-size: 90%"> '''Figure 1.''' View of the <i>iMK1321</i> model diagram in BioUML. Double-click of the left mouse button the diagram icon (marked red as 1) opens the diagram in the <b>Work Space</b> (marked red as 2).</span> | ||
| + | |||
| + | |||
| + | <h5> Flux Balance tab in the Operations Field</h5> | ||
| + | To launch the analysis, move to the <b><i>Flux Balance</i></b> tab in the <b>Operations Field</b> (Figure 1, marked red at the bottom) and push the corresponding button in upper left corner of the tab (marked red as 3). It will lead to pop-up window where a specification of the analysis settings is required. | ||
| + | |||
| + | [[File:FBA_viaDiagram_Fig2_18_03.png|1000px]] | ||
| + | |||
| + | <span style="font-size: 90%"> '''Figure 2.''' Solver type selection and specification of the optimization (maximize or minimize the objective function's value) in BioUML. One-click of the left mouse button <b><i>Ok</i></b> button runs the FBA.</span> | ||
| + | |||
| + | |||
| + | <h5> Optimal solution in the tab</h5> | ||
| + | The outcome of the FBA will be automatically presented upon completion of the analysis in the <b><i>Flux Balance</i></b> tab. | ||
| + | |||
| + | [[File:FBA_viaDiagram_Fig3_18_03.png|1000px]] | ||
| + | |||
| + | <span style="font-size: 90%"> '''Figure 3.''' Results of the FBA in corresponding tab for <i>iMK1321</i> model. The flux distribution of the model is marked red at the bottom.</span> | ||
| + | |||
| + | |||
| + | The flux distribution can be saved as a table via one-click of the left mouse button the save icon in upper left corner of the tab (Figure 3, marked red as 1). It will lead to pop-up window where a specification of the path and name of the table file are required. | ||
| + | |||
| + | [[File:FBA_viaDiagram_Fig4_18_03.png|1000px]] | ||
| + | |||
| + | <span style="font-size: 90%"> '''Figure 4.''' Specification of the path and name of the table file with the output flux distribution of the model.</span> | ||
| + | |||
| + | |||
| + | As a result, the table will be automatically opened in the <b>Work Space</b>. The table consists of two columns: reaction ID and optimal value of the reaction flux obtained by FBA. | ||
| + | |||
| + | [[File:FBA_viaDiagram_Fig5_18_03.png|1000px]] | ||
| + | |||
| + | <span style="font-size: 90%"> '''Figure 5.''' Resulting FBA table usage for <i>iMK1321</i> model.</span> | ||
| + | |||
</font size="3"> | </font size="3"> | ||
| − | == | + | |
| + | |||
| + | ==FBA via Analysis tab== | ||
<font size="3"> | <font size="3"> | ||
| − | [[ | + | FBA can be also conducted via the [[Flux Balance Constraint (analysis)|Flux Balance Constraint]] (FBC) analysis in the [[BioUML]]. |
| − | [[File: | + | Firstly, move to <b>Analysis</b> tab in the <b>Tree Area</b> by a single click with the right mouse button on the corresponding tab. |
| − | To start work with the [[Flux Balance Constraint (analysis)|Flux Balance Constraint]] analysis one needs a {{Type link|diagram}} and a special table with data about its fluxes (names, bounds, objective function coefficients, etc.). Analysis enables to select path to the {{Type link|diagram}}, to the data table and to the table with results. | + | |
| + | <h5> FBC data table creation </h5> | ||
| + | |||
| + | To start the analysis via the tab it is required to create the table with flux balance constraint data. It can be created via [[Building Flux Balance DataTable (analysis)|Building Flux Balance Data Table]] analysis. | ||
| + | It is worth noting that the [[Building Flux Balance DataTable (analysis)|Building Flux Balance Data Table]] analysis and "FBC table" tab work only with [[SBML (file format)|SBML]] L3v1 {{Type link|diagram}}s with special <b><i>fbc</i></b> package. Thus, if the {{Type link|diagram}} does not satisfy these conditions it should be transformed before using this analysis. For example, if the {{Type link|diagram}} does not use <b><i>fbc</i></b> package but contains all necessary information about fluxes, it should be preprocessed by [[Recon transformer (analysis)|Recon transformer]] firstly. | ||
| + | |||
| + | [[File:FBA_viaAnalysis_Fig1_18_03.png|1000px]] | ||
| + | |||
| + | <span style="font-size: 90%"> '''Figure 6.''' View of <b>Building Flux Balance Data Table</b> analysis. Double-click of the left mouse button the analysis icon (marked red) opens the analysis settings in the <b>Work Space</b> (marked red). It is necessary to specify a path to the diagram, output path for the table and values of lower and upper bounds in mmol*gDCW<sup>-1</sup>*h<sup>-1</sup>.</span> | ||
| + | |||
| + | |||
| + | One click of the left mouse button on the <b><i>Run</i></b> will launch the analysis. The resulting Flux Balance Data Table for FBA will be automatically opened in the <b>Work Space</b> as an output of the analysis. | ||
| + | |||
| + | [[File:FBA_viaAnalysis_Fig2_18_03.png|1000px]] | ||
| + | |||
| + | <span style="font-size: 90%"> '''Figure 7.''' Resulting Flux Balance Data Table for <i>iMK1321</i> model. The objective function of the model is marked red.</span> | ||
| + | |||
| + | |||
| + | <h5> FBC analysis usage </h5> | ||
| + | |||
| + | To start work with the [[Flux Balance Constraint (analysis)|Flux Balance Constraint]] analysis one needs a {{Type link|diagram}} and a special table with data about its fluxes (names, bounds, objective function coefficients, etc.). To open the analysis settings in the <b>Work Space</b> double-click of the left mouse button the analysis icon (marked red). | ||
| + | |||
| + | [[File:FBA_viaAnalysis_Fig3_18_03.png|1000px]] | ||
| + | |||
| + | <span style="font-size: 90%"> '''Figure 8.''' <b>[[Flux Balance Constraint (analysis)|Flux Balance Constraint]]</b> analysis in the [[BioUML]].</span> | ||
| + | |||
| + | |||
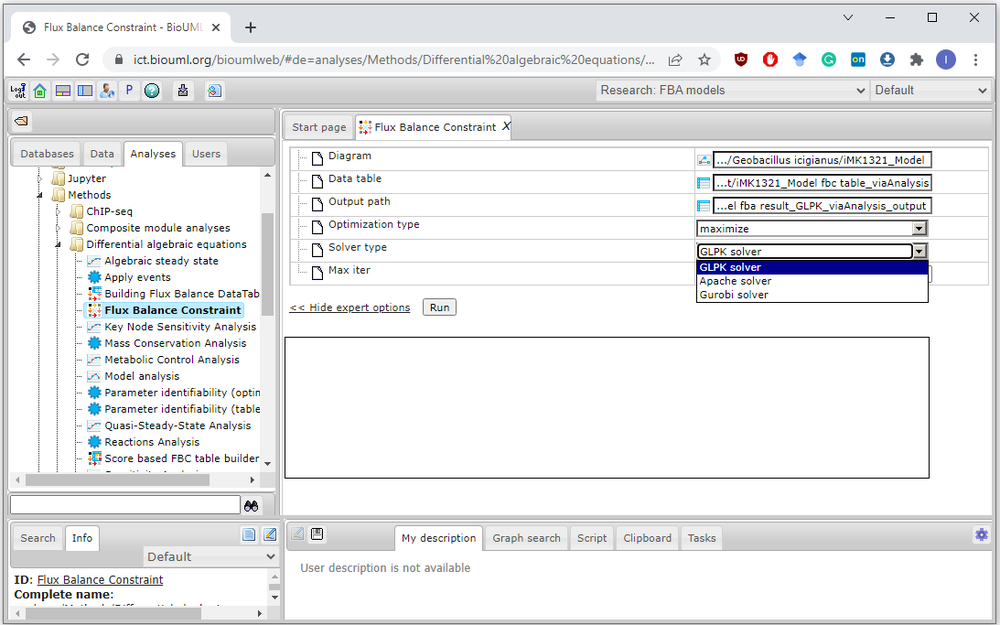
| + | Analysis enables to select path to the {{Type link|diagram}}, to the data table and to the table with output results. It has also an expert mode where user can select type of the objective function, solver type (GLPK, Apache simplex solver and Gurobi solver are available) and some solver's properties. | ||
| + | |||
| + | [[File:FBA_viaAnalysis_Fig4_18_03.png|1000px]] | ||
| + | |||
| + | <span style="font-size: 90%"> '''Figure 9.''' Solver type selection in the FBC analysis.</span> | ||
| + | |||
| + | |||
| + | One click of the left mouse button on the <b><i>Run</i></b> will launch the analysis. The outcome of the FBA will be automatically opened in the <b>Work Space</b> as an output table of the analysis. | ||
| + | |||
| + | [[File:FBA_viaAnalysis_Fig5_18_03.png|1000px]] | ||
| + | |||
| + | <span style="font-size: 90%"> '''Figure 10.''' Resulting "FBC table" tab usage for <i>iMK1321</i> model. The objective function's value of the model is marked red.</span> | ||
</font size="3"> | </font size="3"> | ||
| − | == | + | |
| + | |||
| + | ==FBA using Jupyter Notebook== | ||
<font size="3"> | <font size="3"> | ||
| − | [[ | + | Furthermore, the Jupyter Notebook core in BioUML has been extented on our web-server to run this type of models using well-known [http://dx.doi.org/doi:10.1186/1752-0509-7-74 COBRAPy package] and corresponding [https://ict.biouml.org/bioumlweb/#de=data/Collaboration/FBA%20models/Data/Geobacillus%20icigianus/FBA_in_BioUML.ipynb Jupyter Notebook] has been created to run the [https://doi.org/10.3390/microorganisms8071002 <i>iMK1321</i> metabolic model] using [http://www.gnu.org/software/glpk/glpk.html GLPK (GNU Linear Programming Kit) solver] as an example. To open the Notebook, double-click of the left mouse button the file name in the <b>Tree Area</b> (marked red below). |
| − | + | ||
| − | + | [[File:FBA_viaJNotebook_Fig1_18_03.png|1000px]] | |
| + | |||
| + | <span style="font-size: 90%"> '''Figure 11.''' User guide: FBA via COBRApy in BioUML for <i>iMK1321</i> model.</span> | ||
</font size="3"> | </font size="3"> | ||
Latest revision as of 18:06, 18 March 2022
Constraint-based flux balance analysis (FBA) is a mathematical approach that enables to provide a holistic view of the cellular metabolism in pro- and eukaryotes and predict flux distribution in a global (on a genome-scale level) metabolic network both under a range of environmental conditions and genetic perturbations. The maximization of the biomass equation is typically used as an objective function of the model for FBA. There are two ways to run the analysis in the BioUML. Below is a step-by-step instruction for both ways.
Contents |
[edit] FBA via Diagram
If the ![]() diagram contains fluxes properties written as fbc extension of the SBML "FBC table" tab can be used. Advantage of this tab usage is lack of necessity in creation table with data about fluxes: it will be created automatically using
diagram contains fluxes properties written as fbc extension of the SBML "FBC table" tab can be used. Advantage of this tab usage is lack of necessity in creation table with data about fluxes: it will be created automatically using ![]() diagram. The step-by-step instruction of the analysis will be demonstrated on the iMK1321 model for Geobacillus icigianus developed by our research group and recently published. Note: opening of the large-size diagram may take a while due to the size and layouting of the diagram.
diagram. The step-by-step instruction of the analysis will be demonstrated on the iMK1321 model for Geobacillus icigianus developed by our research group and recently published. Note: opening of the large-size diagram may take a while due to the size and layouting of the diagram.
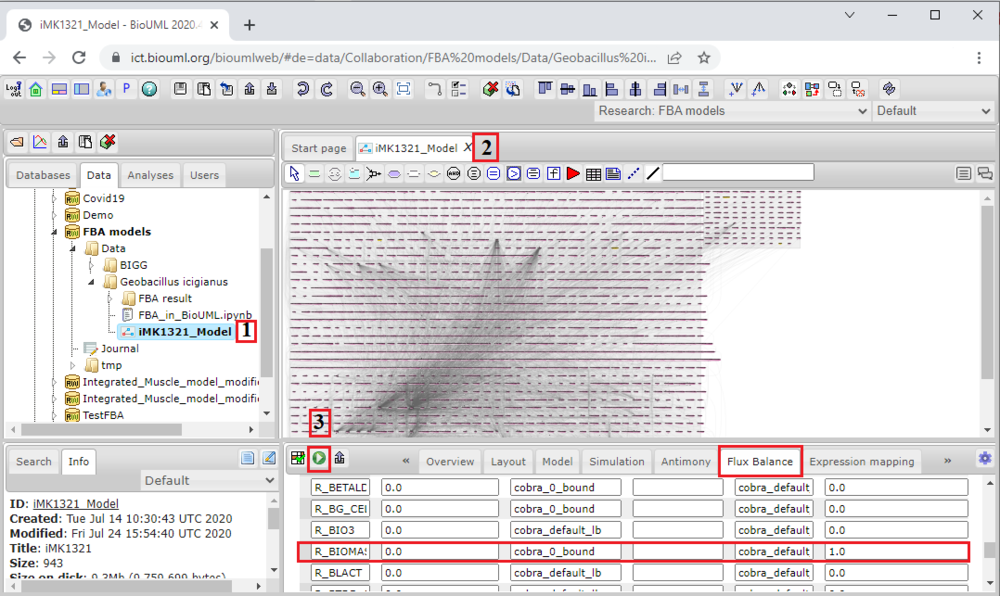
Figure 1. View of the iMK1321 model diagram in BioUML. Double-click of the left mouse button the diagram icon (marked red as 1) opens the diagram in the Work Space (marked red as 2).
Flux Balance tab in the Operations Field
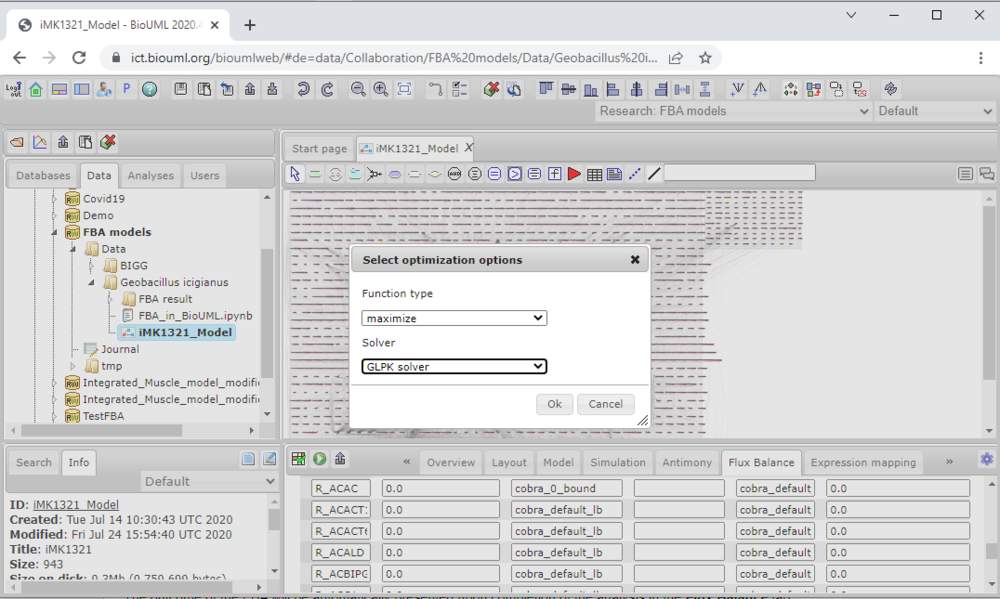
To launch the analysis, move to the Flux Balance tab in the Operations Field (Figure 1, marked red at the bottom) and push the corresponding button in upper left corner of the tab (marked red as 3). It will lead to pop-up window where a specification of the analysis settings is required.
Figure 2. Solver type selection and specification of the optimization (maximize or minimize the objective function's value) in BioUML. One-click of the left mouse button Ok button runs the FBA.
Optimal solution in the tab
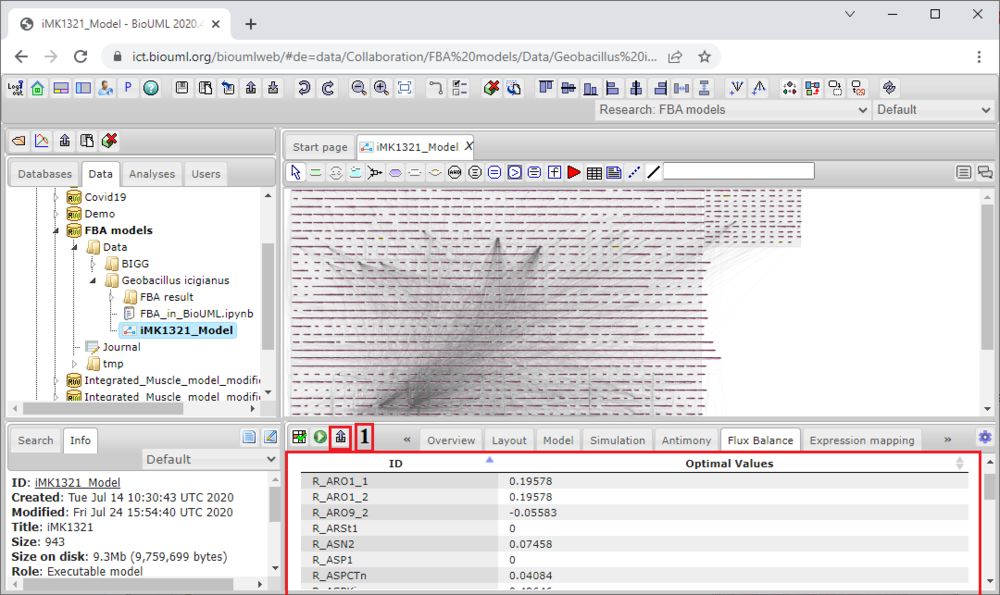
The outcome of the FBA will be automatically presented upon completion of the analysis in the Flux Balance tab.
Figure 3. Results of the FBA in corresponding tab for iMK1321 model. The flux distribution of the model is marked red at the bottom.
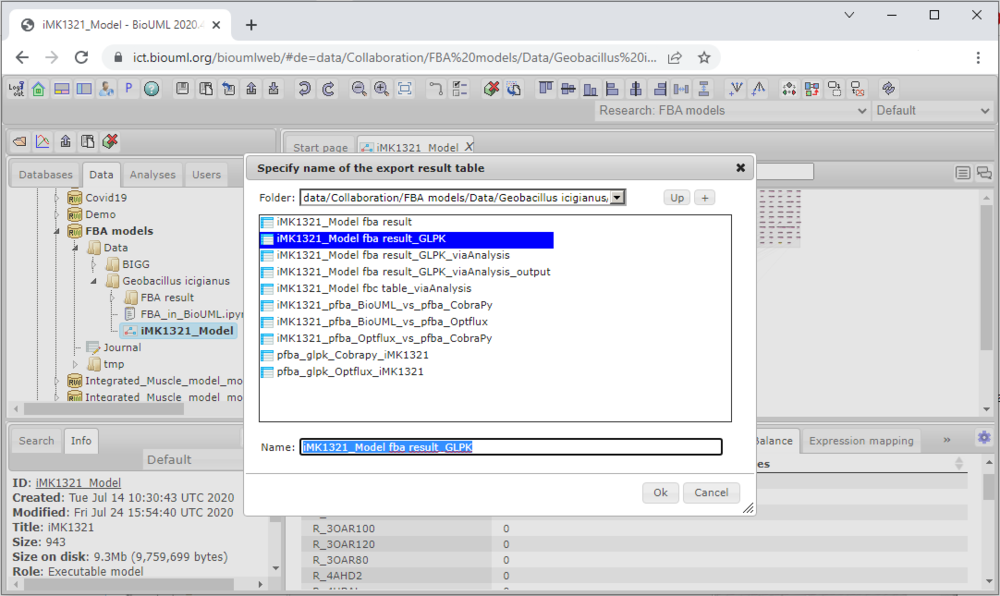
The flux distribution can be saved as a table via one-click of the left mouse button the save icon in upper left corner of the tab (Figure 3, marked red as 1). It will lead to pop-up window where a specification of the path and name of the table file are required.
Figure 4. Specification of the path and name of the table file with the output flux distribution of the model.
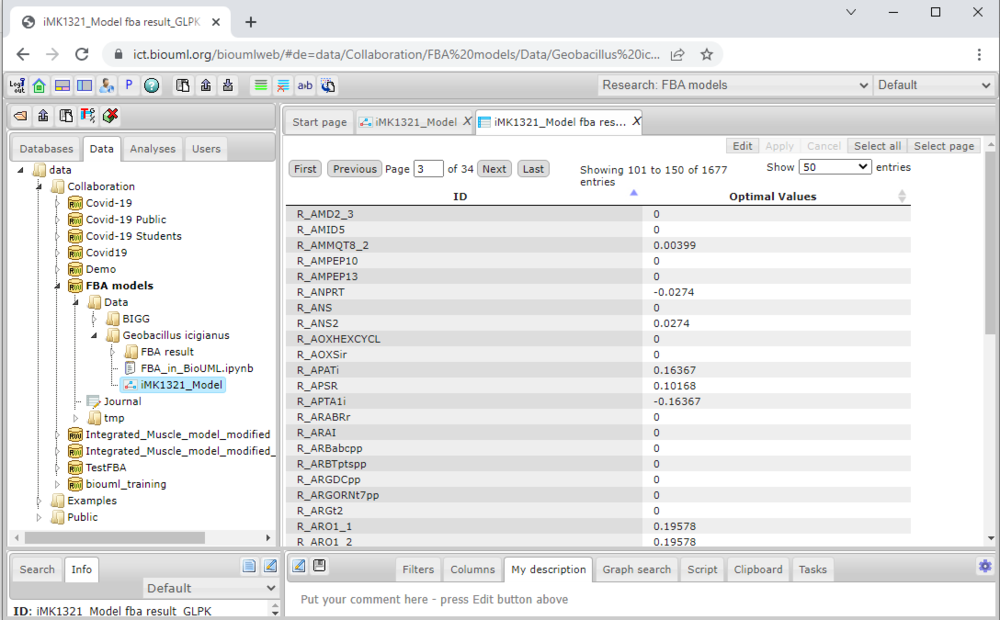
As a result, the table will be automatically opened in the Work Space. The table consists of two columns: reaction ID and optimal value of the reaction flux obtained by FBA.
Figure 5. Resulting FBA table usage for iMK1321 model.
[edit] FBA via Analysis tab
FBA can be also conducted via the Flux Balance Constraint (FBC) analysis in the BioUML. Firstly, move to Analysis tab in the Tree Area by a single click with the right mouse button on the corresponding tab.
FBC data table creation
To start the analysis via the tab it is required to create the table with flux balance constraint data. It can be created via Building Flux Balance Data Table analysis.
It is worth noting that the Building Flux Balance Data Table analysis and "FBC table" tab work only with SBML L3v1 ![]() diagrams with special fbc package. Thus, if the
diagrams with special fbc package. Thus, if the ![]() diagram does not satisfy these conditions it should be transformed before using this analysis. For example, if the
diagram does not satisfy these conditions it should be transformed before using this analysis. For example, if the ![]() diagram does not use fbc package but contains all necessary information about fluxes, it should be preprocessed by Recon transformer firstly.
diagram does not use fbc package but contains all necessary information about fluxes, it should be preprocessed by Recon transformer firstly.
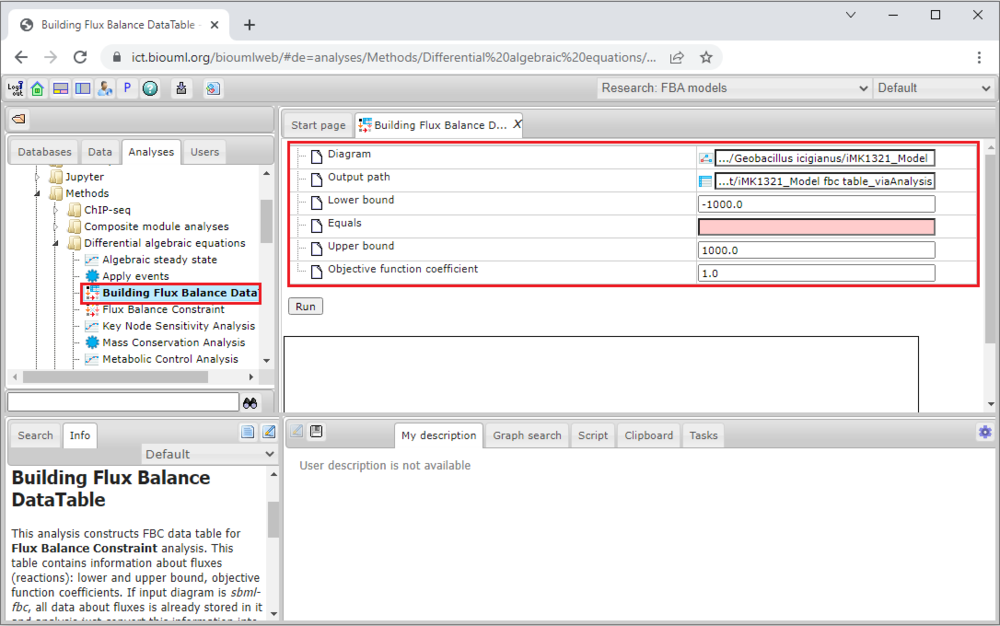
Figure 6. View of Building Flux Balance Data Table analysis. Double-click of the left mouse button the analysis icon (marked red) opens the analysis settings in the Work Space (marked red). It is necessary to specify a path to the diagram, output path for the table and values of lower and upper bounds in mmol*gDCW-1*h-1.
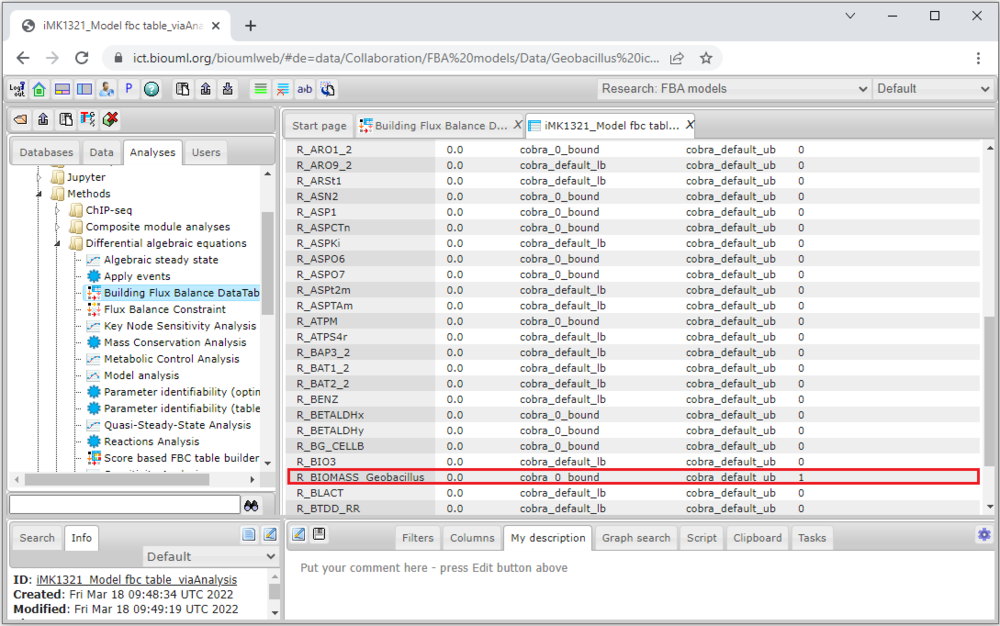
One click of the left mouse button on the Run will launch the analysis. The resulting Flux Balance Data Table for FBA will be automatically opened in the Work Space as an output of the analysis.
Figure 7. Resulting Flux Balance Data Table for iMK1321 model. The objective function of the model is marked red.
FBC analysis usage
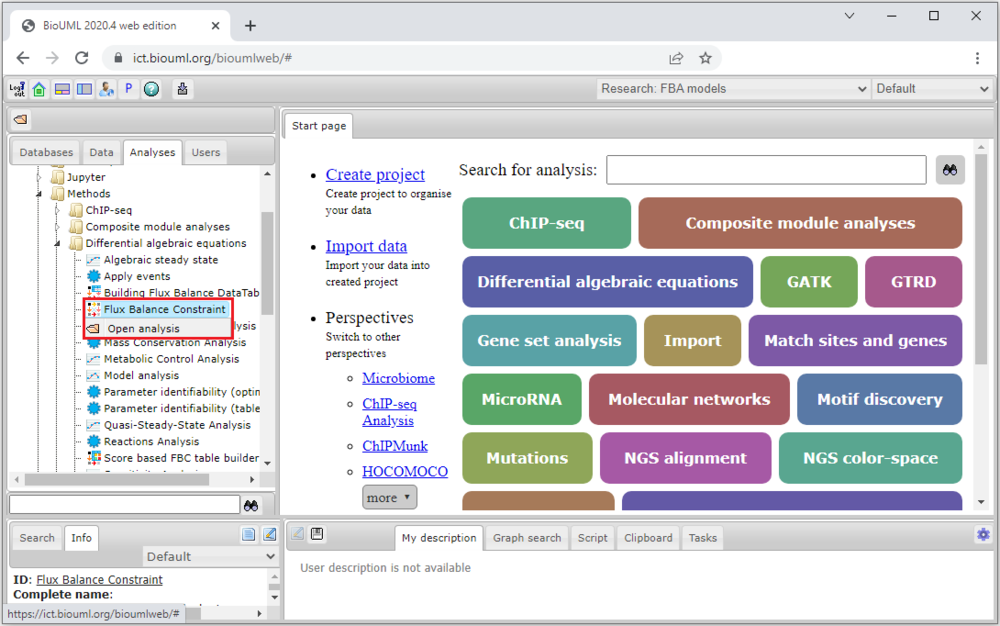
To start work with the Flux Balance Constraint analysis one needs a ![]() diagram and a special table with data about its fluxes (names, bounds, objective function coefficients, etc.). To open the analysis settings in the Work Space double-click of the left mouse button the analysis icon (marked red).
diagram and a special table with data about its fluxes (names, bounds, objective function coefficients, etc.). To open the analysis settings in the Work Space double-click of the left mouse button the analysis icon (marked red).
Figure 8. Flux Balance Constraint analysis in the BioUML.
Analysis enables to select path to the ![]() diagram, to the data table and to the table with output results. It has also an expert mode where user can select type of the objective function, solver type (GLPK, Apache simplex solver and Gurobi solver are available) and some solver's properties.
diagram, to the data table and to the table with output results. It has also an expert mode where user can select type of the objective function, solver type (GLPK, Apache simplex solver and Gurobi solver are available) and some solver's properties.
Figure 9. Solver type selection in the FBC analysis.
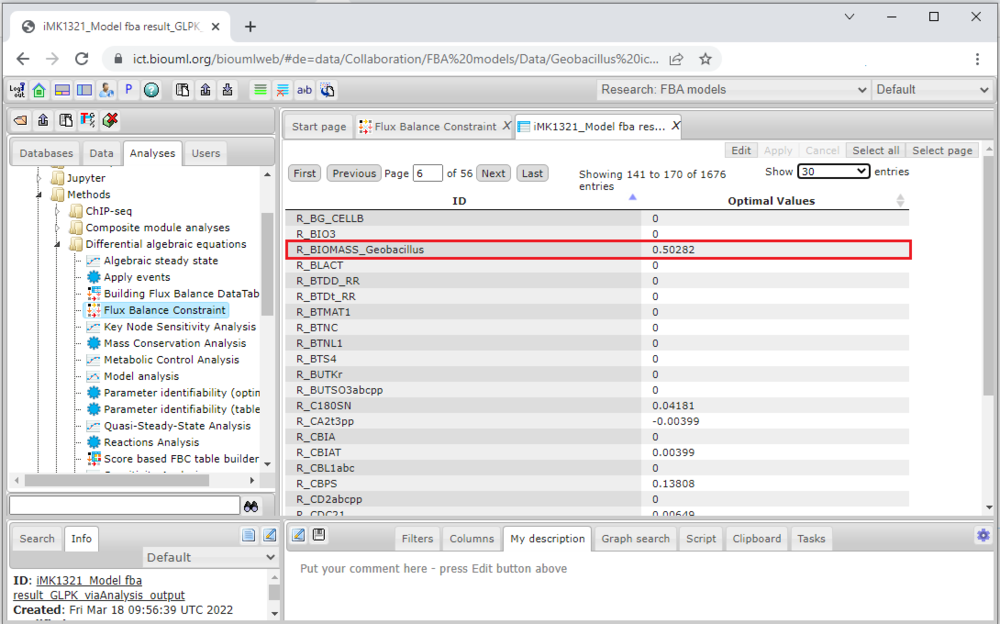
One click of the left mouse button on the Run will launch the analysis. The outcome of the FBA will be automatically opened in the Work Space as an output table of the analysis.
Figure 10. Resulting "FBC table" tab usage for iMK1321 model. The objective function's value of the model is marked red.
[edit] FBA using Jupyter Notebook
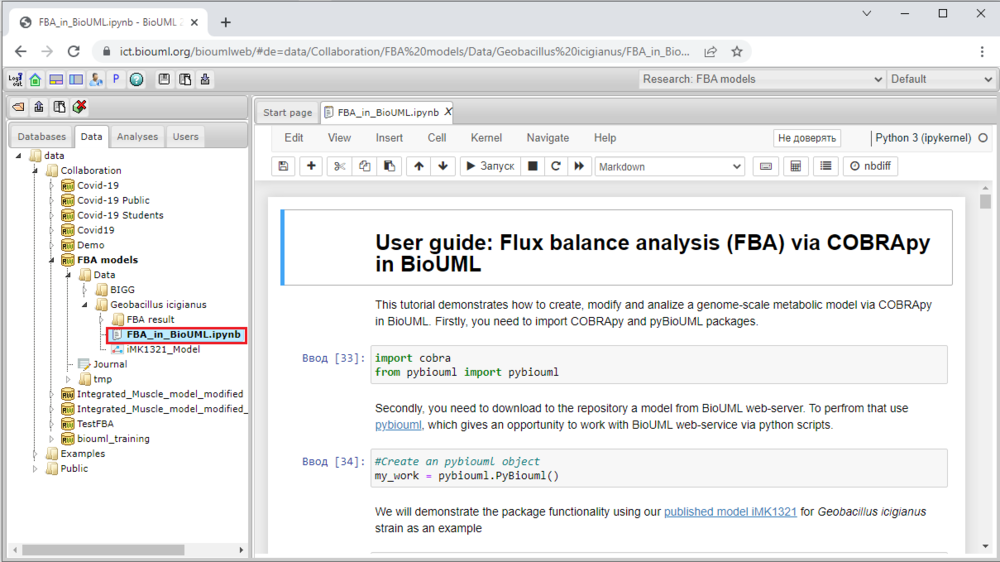
Furthermore, the Jupyter Notebook core in BioUML has been extented on our web-server to run this type of models using well-known COBRAPy package and corresponding Jupyter Notebook has been created to run the iMK1321 metabolic model using GLPK (GNU Linear Programming Kit) solver as an example. To open the Notebook, double-click of the left mouse button the file name in the Tree Area (marked red below).
Figure 11. User guide: FBA via COBRApy in BioUML for iMK1321 model.
