Difference between revisions of "Analyze SNP list (GTRD) (workflow)"
m (Protected "Analyze SNP list (GTRD) (workflow)": Autogenerated page ([edit=sysop] (indefinite))) |
(Automatic synchronization with BioUML) |
||
| Line 5: | Line 5: | ||
== Workflow overview == | == Workflow overview == | ||
[[File:Analyze-SNP-list-GTRD-workflow-overview.png|400px]] | [[File:Analyze-SNP-list-GTRD-workflow-overview.png|400px]] | ||
| + | == Description == | ||
| + | This workflow is designed to analyze the SNP list and to predict TFBSs around regulatory SNPs. Any list with SNP IDs (in the format rs…) can be used as an input. | ||
| + | |||
| + | In the first step, the “SNP matching” analysis maps input SNPs on the genome. The result of this step is an annotated SNP table and corresponding track file with all SNPs. | ||
| + | |||
| + | The track file with all SNPs is further converted into a gene set using “Track to gene set” analysis. This step identifies genes located within the region -10000 to 10000 around each SNP in the list, and returns a schematic map of SNPs in genes mapped to either exons, introns or flanking regions. | ||
| + | |||
| + | This annotated SNP table is filtered using the “Filter table” analysis, which results in two tables, SNPs in exons and other SNPs. | ||
| + | |||
| + | The SNPs located in introns or in gene flanking regions are referred to as regulatory SNPs. They are further analyzed for their overlap with TFBSs. To this end, the track with regulatory SNPs is further processed using “Site search on track” and “Site search results optimization” to find TFBSs enriched around regulatory SNPs as compared to random genomic positions. The workflow uses the default profile “weak threshold” from the GTRD library, but other GTRD profiles can be chosen by the user. The region around SNPs analyzed for TFBSs is 15 bp on each flank, it is available in the input form and can be modified. | ||
| + | |||
| + | The output is a result folder with three subfolders called “all SNPs”, “SNPs in exons” and “SNPs regulatory”, containing the resulting tables and tracks for the corresponding SNPs. All tracks can be used immediately to visualize SNPs, nearby located genes, as well as overlapping TFBS on chromosomes | ||
| + | |||
| + | |||
| + | |||
== Parameters == | == Parameters == | ||
;Input SNP Table | ;Input SNP Table | ||
| + | :Select Input SNP Table | ||
;5<nowiki>'</nowiki> and 3<nowiki>'</nowiki> gene bound extension | ;5<nowiki>'</nowiki> and 3<nowiki>'</nowiki> gene bound extension | ||
| + | :Set 5<nowiki>'</nowiki> and 3<nowiki>'</nowiki> gene bound extension | ||
;Profile | ;Profile | ||
| + | :Select profile | ||
;SNP surrounding region, bp | ;SNP surrounding region, bp | ||
| + | :Set SNP surrounding region, bp | ||
;Species | ;Species | ||
| + | :Set species | ||
;Results Folder | ;Results Folder | ||
| + | :Select Results Folder | ||
[[Category:Workflows]] | [[Category:Workflows]] | ||
[[Category:GeneXplain workflows]] | [[Category:GeneXplain workflows]] | ||
[[Category:Autogenerated pages]] | [[Category:Autogenerated pages]] | ||
Revision as of 13:34, 30 May 2013
- Workflow title
- Analyze SNP list (GTRD)
- Provider
- geneXplain GmbH
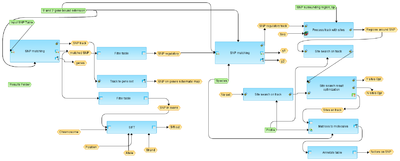
Workflow overview
Description
This workflow is designed to analyze the SNP list and to predict TFBSs around regulatory SNPs. Any list with SNP IDs (in the format rs…) can be used as an input.
In the first step, the “SNP matching” analysis maps input SNPs on the genome. The result of this step is an annotated SNP table and corresponding track file with all SNPs.
The track file with all SNPs is further converted into a gene set using “Track to gene set” analysis. This step identifies genes located within the region -10000 to 10000 around each SNP in the list, and returns a schematic map of SNPs in genes mapped to either exons, introns or flanking regions.
This annotated SNP table is filtered using the “Filter table” analysis, which results in two tables, SNPs in exons and other SNPs.
The SNPs located in introns or in gene flanking regions are referred to as regulatory SNPs. They are further analyzed for their overlap with TFBSs. To this end, the track with regulatory SNPs is further processed using “Site search on track” and “Site search results optimization” to find TFBSs enriched around regulatory SNPs as compared to random genomic positions. The workflow uses the default profile “weak threshold” from the GTRD library, but other GTRD profiles can be chosen by the user. The region around SNPs analyzed for TFBSs is 15 bp on each flank, it is available in the input form and can be modified.
The output is a result folder with three subfolders called “all SNPs”, “SNPs in exons” and “SNPs regulatory”, containing the resulting tables and tracks for the corresponding SNPs. All tracks can be used immediately to visualize SNPs, nearby located genes, as well as overlapping TFBS on chromosomes
Parameters
- Input SNP Table
- Select Input SNP Table
- 5' and 3' gene bound extension
- Set 5' and 3' gene bound extension
- Profile
- Select profile
- SNP surrounding region, bp
- Set SNP surrounding region, bp
- Species
- Set species
- Results Folder
- Select Results Folder
