Difference between revisions of "Optimization examples"
(→Testing the convergence rate of the optimization methods) |
(→Testing the convergence rate of the optimization methods) |
||
| Line 48: | Line 48: | ||
<td>casp8 →</td> | <td>casp8 →</td> | ||
<td>''k''<sub>5</sub> ⋅ [casp8]</td> | <td>''k''<sub>5</sub> ⋅ [casp8]</td> | ||
| + | </tr> | ||
| + | </table> | ||
| + | </td> | ||
| + | <td> </td> | ||
| + | <td> | ||
| + | <table border="1" align="center" cellspacing="0" cellpadding="4"> | ||
| + | <tr> | ||
| + | <td>'''Initial values'''</td> | ||
| + | </tr> | ||
| + | <tr> | ||
| + | <td>CD95L</td> | ||
| + | <td>113.220</td> | ||
| + | </tr> | ||
| + | <tr> | ||
| + | <td>FADD:CD95R</td> | ||
| + | <td>91.266</td> | ||
| + | </tr> | ||
| + | <tr> | ||
| + | <td>DISC</td> | ||
| + | <td>0.000</td> | ||
| + | </tr> | ||
| + | <tr> | ||
| + | <td>pro8</td> | ||
| + | <td>64.477</td> | ||
| + | </tr> | ||
| + | <tr> | ||
| + | <td>DISC:pro8</td> | ||
| + | <td>0.000</td> | ||
</tr> | </tr> | ||
</table> | </table> | ||
Revision as of 10:22, 15 March 2019
Here we give some examples of the BioUML usage for solving the problem of parameter estimation applied to the models of biochemical pathways. For details about creation your oun optimization document in BioUML, see the chapter Optimization document. Some information about the optimization methods implemented in BioUML is done in the chapter Optimization problem.
Testing the convergence rate of the optimization methods
- Optimization document: data > Examples > Optimization > Data > Documents > test_case_1A
- Model: data > Examples > Optimization > Data > Diagrams > diagram_1A
- Experimental data: data > Examples > Optimization > Data > Experiments > exp_data_1
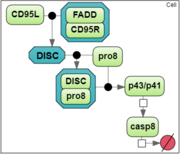
To analyze a convergence rate of the optimization methods implemented in BioUML [1], we considered a reaction chain extracted from the model by Neumann et al. [2] and representing activation of caspase-8 triggered by the receptor CD95 (APO-1/Fas).
|
|
We performed estimation of parameters using the search space defined as:
where upper bounds were chosen based on the order of magnitude of parameter values proposed in [2].
Estimation was based on the experimental data obtained by Neumann et al. [2] for procaspase-8 and its cleaved products p43/p41 and caspase-8.
| Time (min-1) | p43/p41 (nM) | pro-8 (nM) | casp-8 (nM) |
| 0.0 | 0.058 | 59.963 | 0.000 |
| 10.0 | 0.268 | 57.565 | 0.041 |
| 20.0 | 4.760 | 58.590 | 0.316 |
| 30.0 | 8.252 | 59.422 | 1.397 |
| 45.0 | 16.144 | 48.190 | 3.520 |
| 60.0 | 17.021 | 38.950 | 3.947 |
| 90.0 | 15.269 | 23.502 | 4.871 |
| 120.0 | 12.530 | 13.127 | 4.878 |
| 150.0 | 10.335 | 10.703 | 4.228 |
References
- Kutumova E., Ryabova A., Valeev T., Kolpakov F. BioUML plug-in for nonlinear parameter estimation using multiple experimental data. Virtual biology. 2013. 1:47-58.
- Neumann L., Pforr C., Beaudouin J., Pappa A., Fricker N., Krammer P.H., Lavrik I.N., Eils R. Dynamics within the CD95 death-inducing signaling complex decide life and death of cells. Molecular Systems Biology. 2010. 6:352.
