N-Glycan biosynthesis
Contents |
Introduction
N-Linked glycans are attached in the endoplasmic reticulum to the nitrogen (N) in the side chain of asparagine in the sequon. The sequon is an Asn-X-Ser or Asn-X-Thr sequence, where X is any amino acid except proline and the glycan may be composed of N-acetyl galactosamine, galactose, neuraminic acid, N-acetylglucosamine, fructose, mannose, fucose, and other monosaccharides.
N-linked glycans are extremely important in proper protein folding in eukaryotic cells, in cell-cell interactions and in personalized medicine[1].
Mathematical model of N-Glycan biosynthesis
Model realization
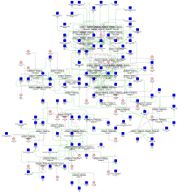
Because of an important role of N-Glycans in personalized medicine it was decided to work out a mathematical model of its biosynthesis in BioUML. The research was begun with Reference pathway from KEGG database implementation [2].
Reaction rate equations were generated by KEGGtranslator[3], a number of necessary parameters, such as Michaelis-Menten constants, were taken from BRENDA Enzyme Database[4].
To give more intuitive representation Glycan structures property was used and to achieve the optimum accuracy we supposed that the distribution of the N-glycans in each Golgi compartment is modeled as a well-mixed reactor[5].
Despite of the simplicity of the reaction mechanisms and reactions' parameters availability, the process of the building of the computer model of glycosylation split into several stages.
The first stage of the modeling
On the first stage of the modeling an attempt to implement the N-glycan biosynthesis model from the KEGG database was made. Reaction equations were generated using KEGGtranslator, reaction parameters were taken from the database BRENDA Enzyme Database, and the initial concentration of the substances were taken as 1 mol. The model included 25 enzymes, 62 glycan, a number of substances – participants of intermediate reactions (formation and dissociation of the enzyme-substrate complex).The model consisted of 68 reactions with 126 parameters in their equations. The localization of enzymes in different parts of Golgi apparatus according to the order of their entry into the reactions was not taken into consideration.
The second stage of the modeling
In the second stage the initial model was split into two parts. For glycans included in the first part the mass spectrometry data was available. So it was possible to check the correctness of the getting results. The second part of the model does not have experimental verification yet. Also an attempt to take into consideration the localization of enzymes in different compartments of the Golgi apparatus according to the order of their entry into the reactions was made. There were the decrease in the number of diagram elements (8 enzymes and 41 glycans, 40 reactions with 39 parameters in the part of the model with the experimental confirmation). Based on experimentally validated information the initial glycan concentrations, except 9-mannose G00011, were taken as 0 mol. The initial concentration of 9-mannose G00011, which was the reactant in the first reaction occurring in the first compartment of the Golgi apparatus, was taken as 300 mol.
The first stage of the modeling
Model optimization
The next step was the model reduction: the decrease in the number of model parameters and materials, which allowed to significantly simplify the model, speed up the Simulation and compare the model results with the experiment.
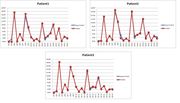
We use the expiremental data for Korcula population [6] and made the Optimization of model parameters was performed for every individual patient.
Results
We carry out parameters optimization for patients from Korcula population. The objective functions, which is calculated as the sum of squared differences between model and experimental concenration, have the order of 0,0000001-0,00000001.
For every patient his/her individual parameters correlate with each other and with age poorly. Random forest analysis can rpedict only about 15% of results.
References
- ↑ en.wikipedia.org/wiki/Glycan
- ↑ N-Glycan biosynthesis - Reference pathway
- ↑ KEGGtranslator
- ↑ BRENDA
- ↑ Systems Analysis of N-Glycan Processing in Mammalian Cells
- ↑ High throughput isolation and glycosylation analysis of IgG-variability and heritability of the IgG glycome in three isolated human populations.


